

The following diagram shows the graph produced by Sanity4J for a Java Development Project. The project began by creating code quickly, with little regard for quality (green line). Sanity4J reports were configured for the project and an 85% quality target was set. Developers began to improve code quality by fixing issues as the project progressed. Towards the go-live date, the team was advised that their code would be subjected to an external review. This caused an increased focus on quality which Sanity4J tracked.
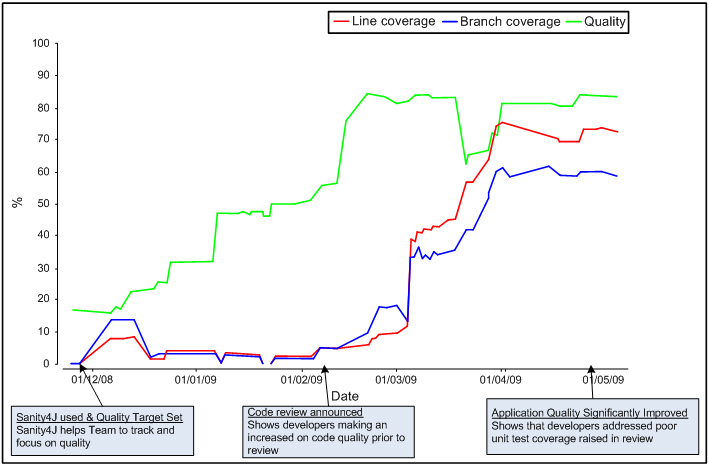
The external code review pointed out that the project had failed to reach Departmental targets for automated unit tests, represented by the red and blue lines. Prior to go-live, the project was able to dramatically increase their level of automated unit testing and their progress was tracked by Sanity4J.
The result was a higher quality product, which is estimated to cost much less to maintain in future years.
The information that Sanity4J tracks was available to developers, project staff and the project executive throughout the development of the project. Sanity4J provided the ability to easily measure and track quality. It is unlikely that the project would have achieved such significant improvements without support from Sanity4J.